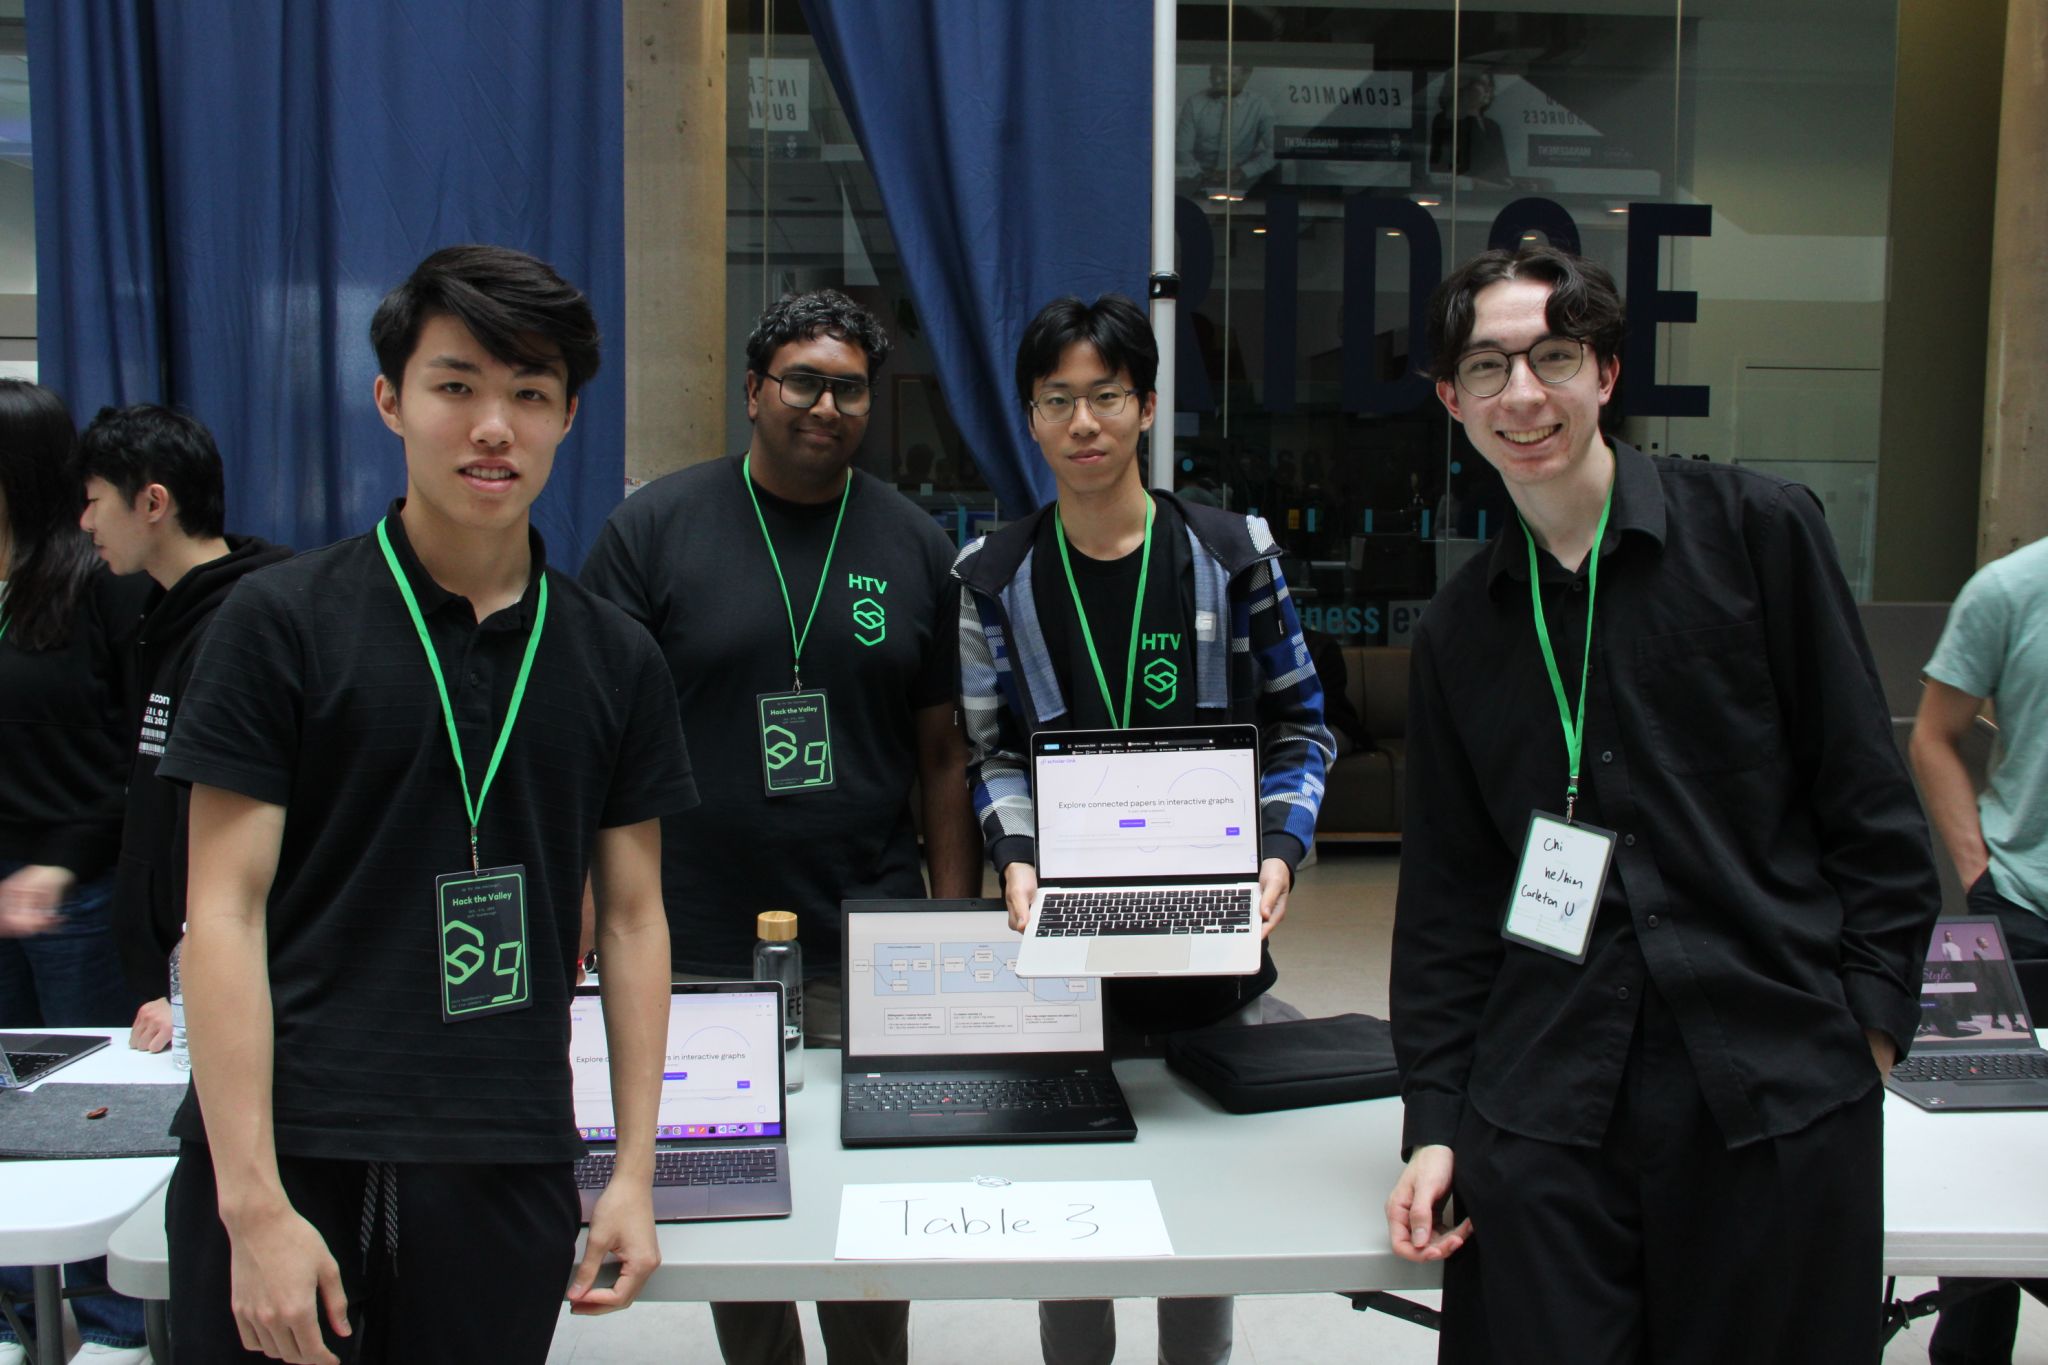
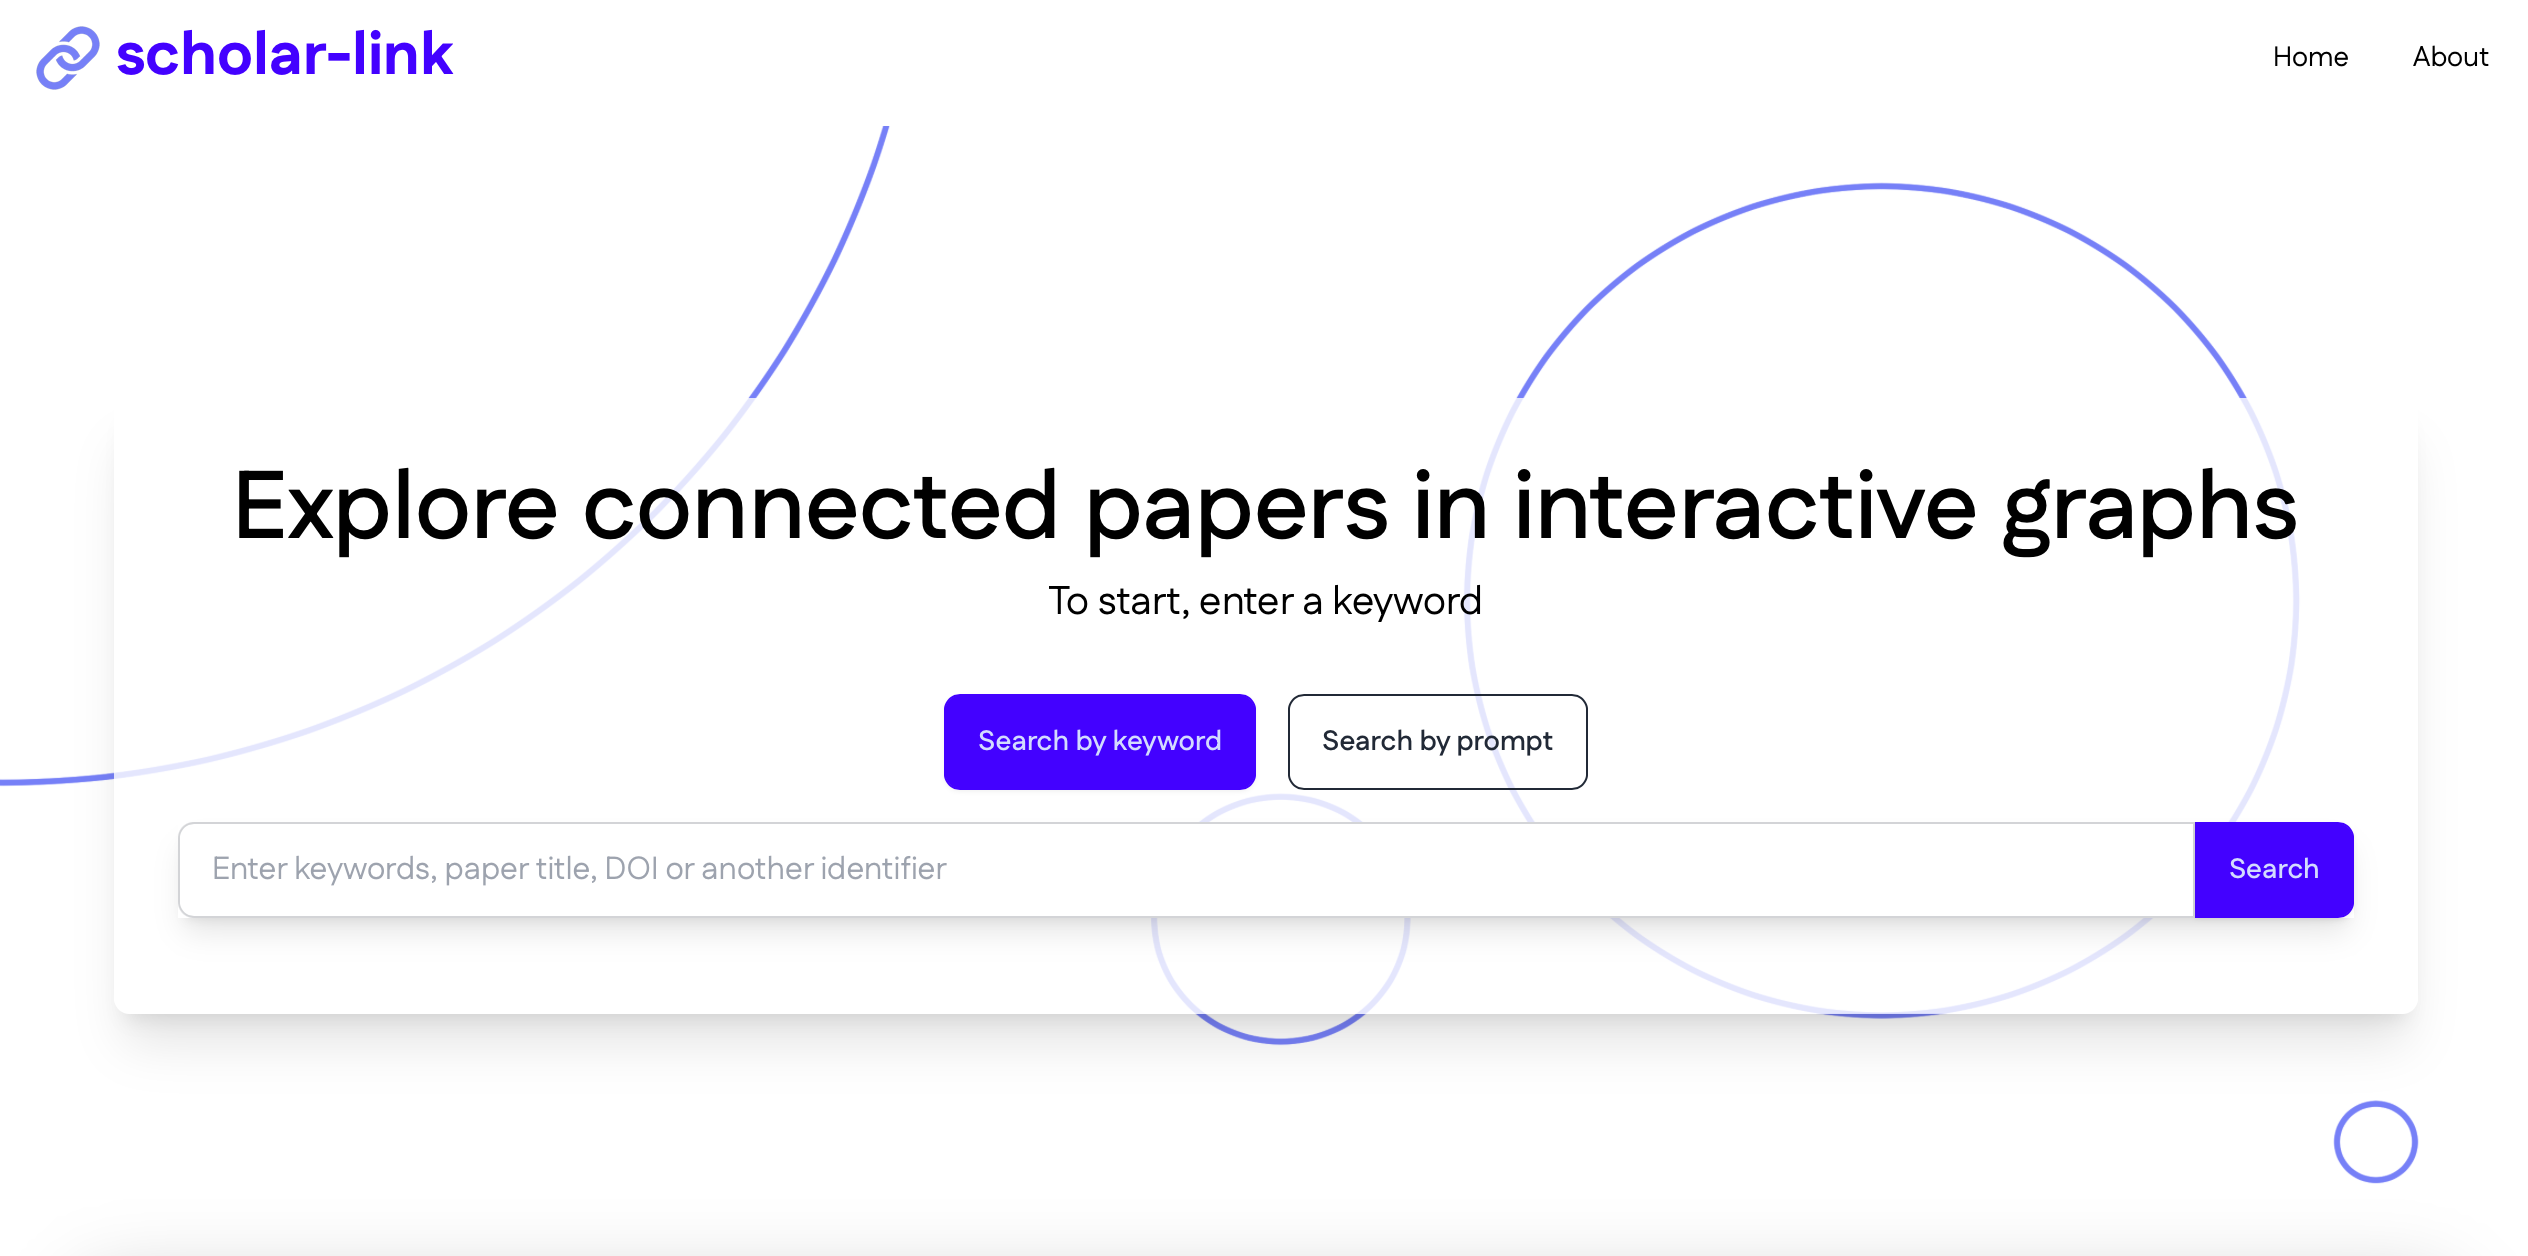
How can we make research more accessible, insightful, and engaging for researchers and students? Eddy, Chi, Jay, and I came up with an innovative web application that leverages cutting-edge AI to visualize connections between papers in a force-directed graph.
Features
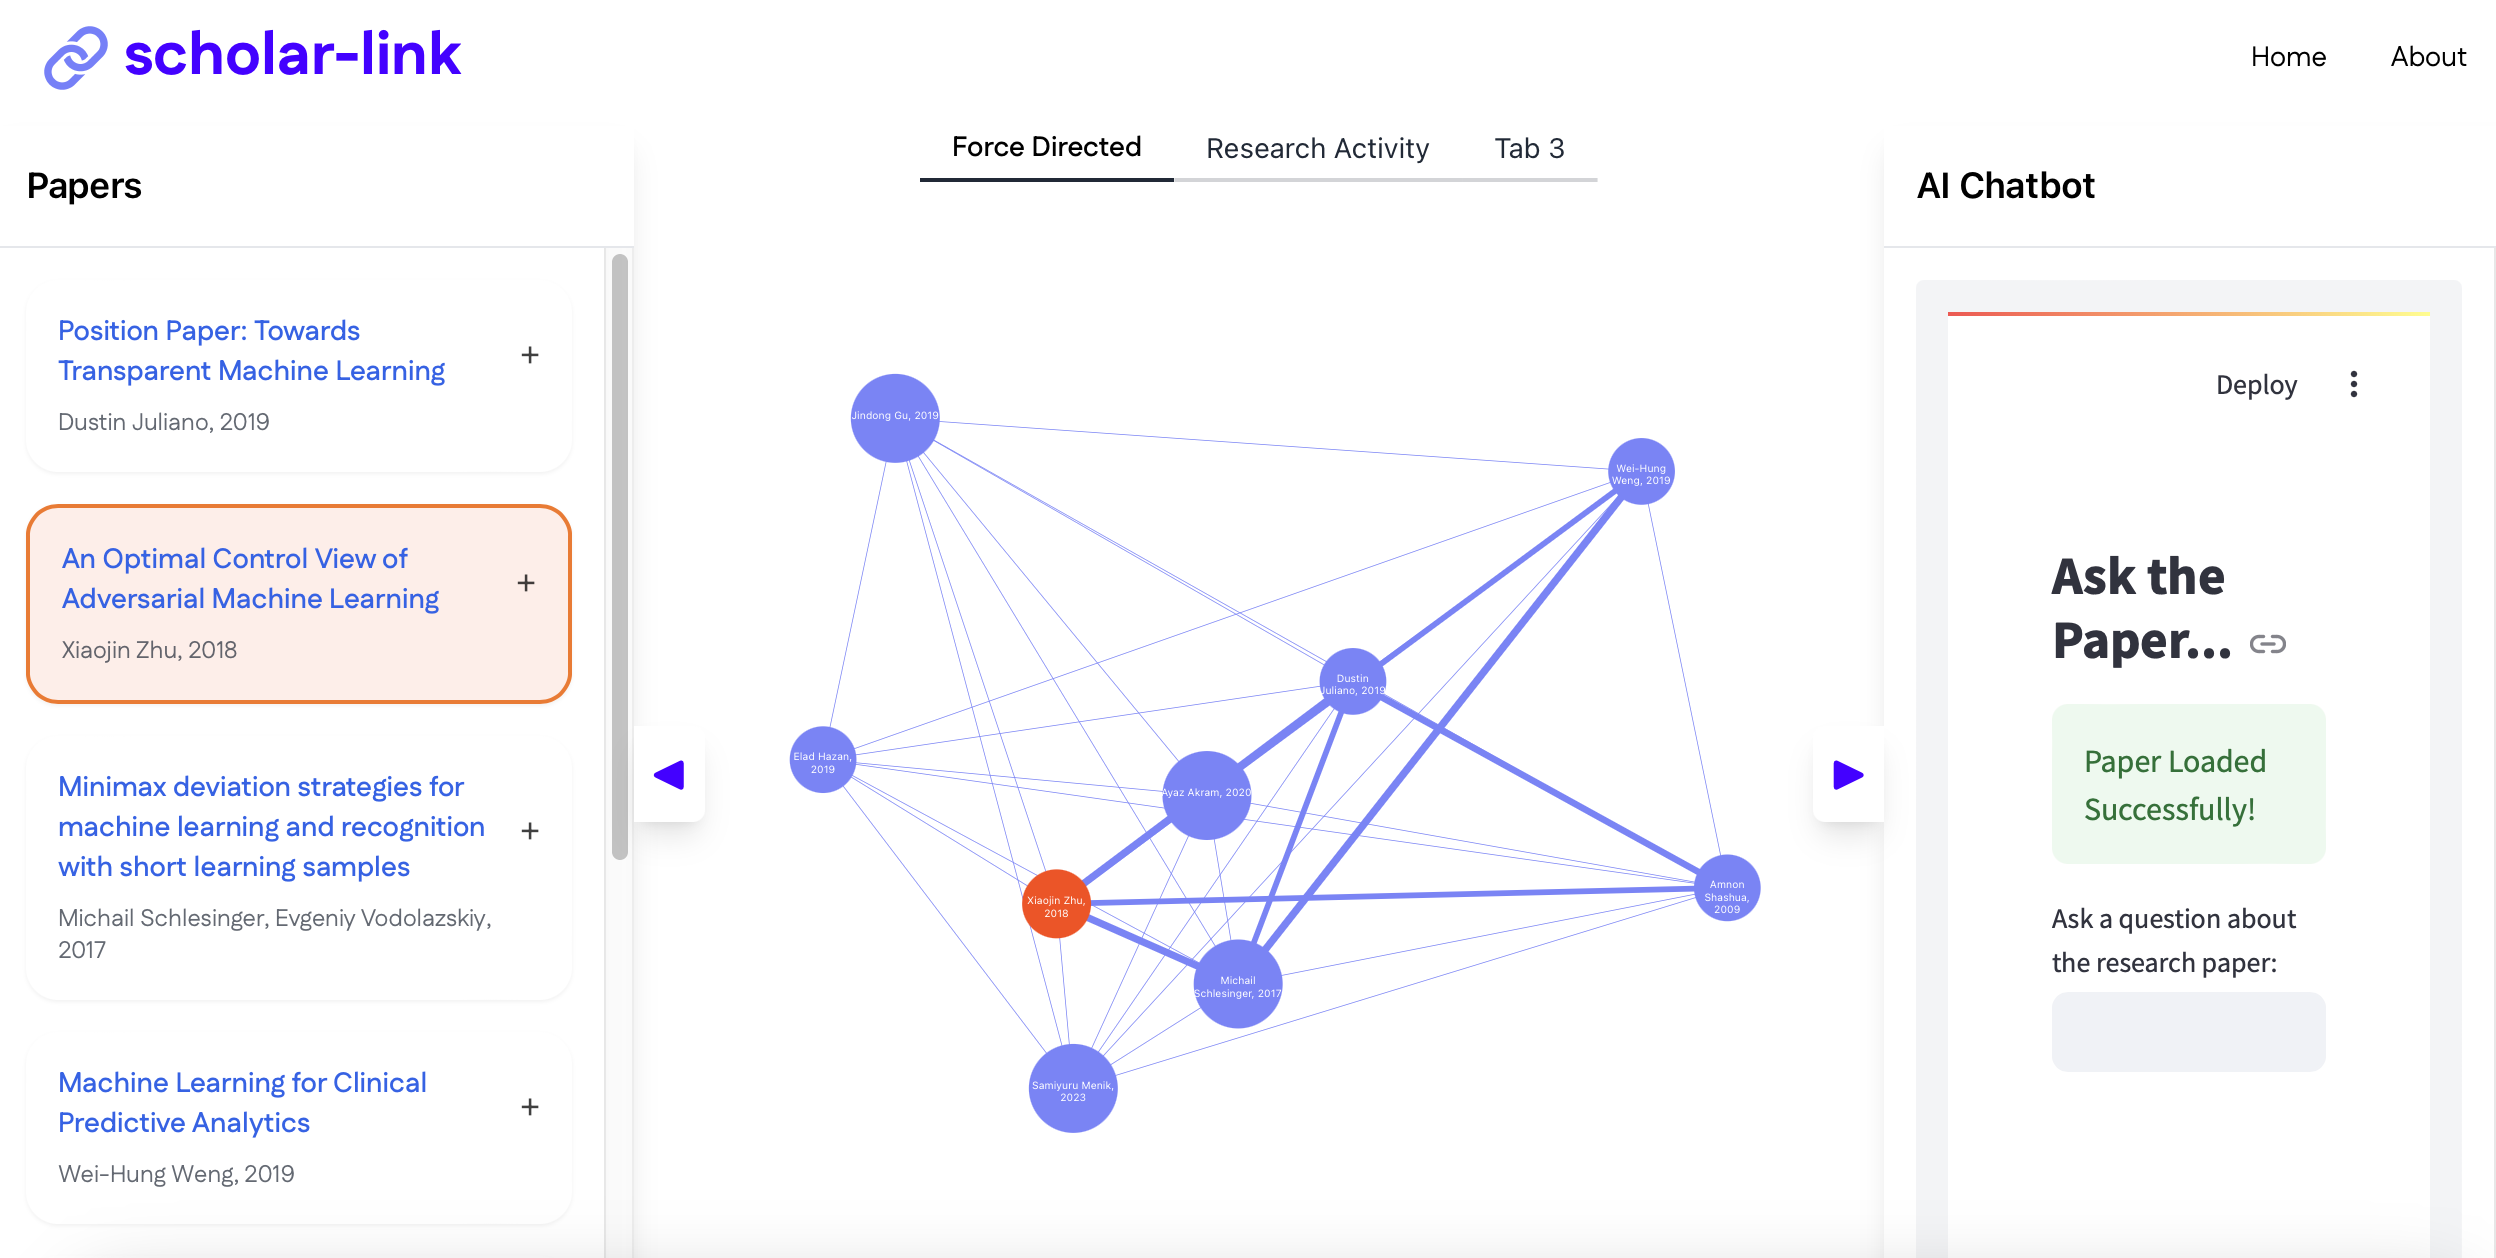
- Interactive Graphs: Visualize paper connections through co-citation and bibliographic coupling.
- Trend Analysis: Spot trends with keyword and activity analysis.
- AI Summarization: Get concise summaries of papers.
- AI Chatbot: Ask questions and get answers about research papers.
- Diverse Data: Access a wide range of papers from open-source databases.
Technologies
- NLP: KeyBert and Hugging Face for content analysis and summaries.
- Graph Theory: Advanced algorithms for optimized graphs.
- Front-end: React.js for a smooth user experience.
- Back-end: Flask and Python for data handling and AI integration.
- Data Collection: Web scraping tools for academic databases.
- Streamlit: Fast deployment for dynamic diagrams and AI ChatBot.